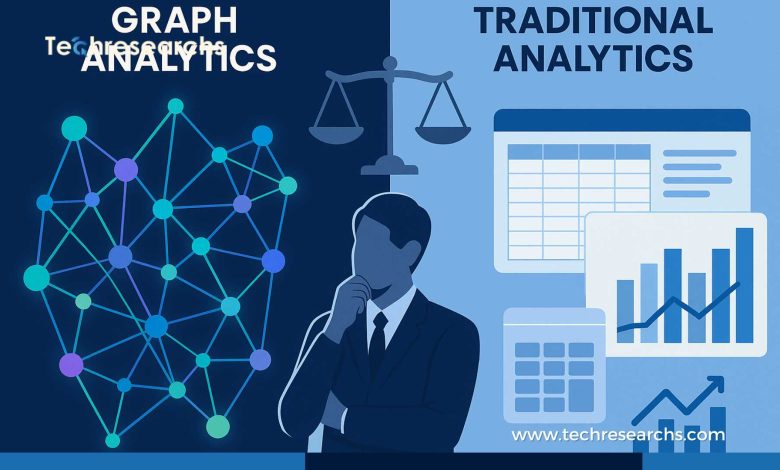
In today’s data-driven world, businesses must make decisions based on vast amounts of information. To process and analyze this data effectively, two approaches are widely used: Graph Analytics and traditional analytics. Both methods offer unique advantages, but their applications and strengths can vary significantly. In this article, we will dive deep into Graph Analytics vs Traditional Analytics to help you determine which approach is best for your business.
Understanding Traditional Analytics
Traditional analytics has long been the go-to approach for analyzing structured data in business. It typically involves statistical analysis and aggregating data into spreadsheets or databases. Businesses use tools like Excel, SQL, or business intelligence (BI) platforms for querying and reporting. This method is effective for numerical data analysis, trend forecasting, and measuring performance against set goals.
Key Features of Traditional Analytics:
- Data Structure: Primarily focuses on structured data, often stored in tabular formats like databases or spreadsheets.
- Use Cases: Best for historical trend analysis, forecasting, and performance metrics.
- Tools: SQL databases, Excel, Power BI, and Tableau.
- Data Relationships: Analyzes data in isolation without much focus on the relationships between variables.
What is Graph Analytics?
Unlike traditional analytics, Graph Analytics is designed to analyze data in the form of networks, relationships, and interconnected data. It focuses on understanding how entities like people, companies, or products are connected. By using graphs—composed of nodes (entities) and edges (relationships)—this approach reveals deeper insights into data, helping businesses understand complex relationships.
Key Features of Graph Analytics:
- Data Structure: Utilizes graph databases, where nodes represent entities and edges represent relationships.
- Use Cases: Ideal for detecting patterns in networks, fraud detection, social network analysis, and recommendation engines.
- Tools: Neo4j, Amazon Neptune, and Microsoft Azure Cosmos DB.
- Data Relationships: Focuses on the relationships between data points, making it ideal for complex network analysis.
Graph Analytics vs Traditional Analytics: A Comparison
1. Handling of Data Relationships
- Traditional Analytics: In traditional analytics, data is typically examined in isolation, making it harder to uncover hidden relationships. For example, traditional analytics may identify sales trends but not how customer demographics interact with those trends.
- Graph Analytics: Graph-based analysis excels at uncovering relationships between entities. It can reveal hidden insights, such as how customers influence each other’s buying behavior or how one product’s sales affect another. By analyzing the data as a network, graph-based methods reveal the connections that may not be immediately obvious.
2. Scalability and Flexibility
- Traditional Analytics: Works best with structured data and is often limited in scope. As data grows, it can become difficult to scale traditional systems without significant restructuring.
- Graph Analytics: Graph databases are designed for scalability and can easily handle large amounts of interconnected data. Whether you’re dealing with social media networks, supply chains, or customer networks, graph-based analytics can adapt and scale efficiently.
3. Insights and Complexity
- Traditional Analytics: While traditional methods provide valuable insights, they are best suited for linear or tabular data. The more complex the data relationships, the less effective traditional methods become.
- Graph Analytics: Graph analysis excels in complex, interconnected datasets. It can identify patterns, clusters, and anomalies within networks that would otherwise go unnoticed with traditional methods.
4. Real-Time Data Processing
- Traditional Analytics: Traditional methods often rely on batch processing, meaning there can be a delay in analyzing and acting on real-time data.
- Graph Analytics: Many graph databases are capable of real-time data processing, which allows businesses to react quickly to changes. This is particularly useful for dynamic situations like fraud detection, social media monitoring, and recommendation engines.
When to Use Graph Analytics and Traditional Analytics
When to Choose Graph Analytics:
- Social Networks: Understanding how users are connected to one another, as seen with platforms like Facebook or LinkedIn.
- Fraud Detection: Identifying unusual patterns or connections that could indicate fraudulent activity.
- Recommendation Systems: Recommending products or services based on users’ behavior and relationships with other users.
- Supply Chains: Analyzing the relationships and dependencies between various entities in a supply chain network.
When to Choose Traditional Analytics:
- Trend Analysis: Analyzing historical trends in sales, customer behavior, and market performance.
- Performance Metrics: Measuring key performance indicators (KPIs) for business operations.
- Forecasting: Predicting future outcomes based on historical data.
Graph Analytics vs Traditional Analytics: Pros and Cons
| Aspect | Graph Analytics | Traditional Analytics |
|---|---|---|
| Data Relationships | Excellent at detecting complex relationships | Limited in analyzing relationships |
| Data Structure | Works with interconnected, unstructured data | Best for structured, tabular data |
| Real-Time Processing | Real-time data processing is possible | Often relies on batch processing |
| Scalability | Highly scalable for large datasets | Can become inefficient with large datasets |
| Ease of Use | Requires expertise in graph theory | Easier for businesses to implement and use |
| Use Case Flexibility | Best for network-based problems | Ideal for linear, structured datasets |
Which is Better for Your Business?
The choice between Graph Analytics and traditional analytics ultimately depends on the complexity of your data and the specific needs of your business. If your data is highly interconnected, or if you need to explore relationships between various entities, graph-based analytics is likely the best option. However, if you’re primarily dealing with structured, historical data, traditional methods may still be the better fit.
FAQs
1. What are the main differences between Graph Analytics and Traditional Analytics?
A. Graph Analytics focuses on analyzing relationships between entities using graph structures, while traditional analytics primarily deals with structured, tabular data and statistical analysis.
2. Can Graph Analytics be used for fraud detection?
A. Yes, graph-based methods are excellent for fraud detection as they can uncover hidden patterns and connections within data that may indicate fraudulent behavior.
3. Which tool is best for Graph Analytics?
A. Popular tools for graph-based analysis include Neo4j, Amazon Neptune, and Microsoft Azure Cosmos DB, each offering powerful features for analyzing complex networks.
In the battle of Graph Analytics vs traditional analytics, there’s no one-size-fits-all answer. Both have their strengths and weaknesses, and the right choice depends on the specific challenges your business faces. If you need to analyze interconnected data and gain deep insights into relationships, graph-based methods are the way to go. However, for simpler, structured datasets, traditional methods may still be the better solution.
By carefully considering your business’s needs and the type of data you handle, you can choose the right approach to unlock new insights and drive better decision-making.