Modern businesses depend on data to make decisions, improve customer experiences, automate processes, and measure performance. But what happens when the data behind those decisions is incomplete, outdated, inconsistent, or incorrect?
A small data issue can quickly become a much bigger problem. An inaccurate sales report may influence business planning, a broken data pipeline can interrupt an analytics dashboard, and missing customer information can affect several connected applications. By the time someone notices the problem, the damage may already have spread across the organization.
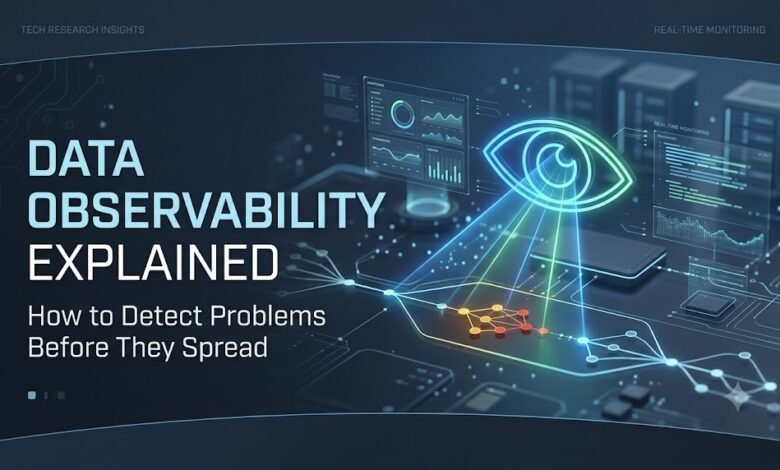
This is where data observability becomes important. It helps technology teams understand the condition of their data, identify unusual changes, and investigate problems before they affect downstream systems.
Rather than waiting for users to report incorrect information, organizations can use data observability to gain earlier visibility into data quality and reliability. In this guide, we explore how data observability works, why it matters, and how businesses can use it to build more dependable data systems.
What Is Data Observability?
Data observability is the practice of monitoring and understanding the health, reliability, and behavior of data as it moves through systems, pipelines, databases, and analytics platforms.
It helps teams answer important questions:
- Is the data arriving when it should?
- Are expected records missing?
- Has the structure of a dataset changed unexpectedly?
- Are values outside their normal range?
- Which reports, applications, or teams could be affected by a data problem?
Traditional data quality checks often focus on specific rules, such as whether a field is empty or a value falls within an acceptable range. Data observability takes a broader view by examining data patterns, pipeline behavior, dependencies, and changes over time.
For example, an online retailer might usually receive thousands of orders every morning. If the incoming order count suddenly drops, data observability can help the team determine whether customer activity has changed or an upstream system has stopped sending records.
The goal is not simply to identify bad data. It is to understand what has changed, why it may have happened, and where the impact could appear.
Why Data Problems Often Spread Before Anyone Notices
Data systems rarely operate in isolation. A single dataset may support several dashboards, machine learning models, financial reports, and operational applications.
This interconnected structure makes small failures difficult to contain.
Consider a company that collects customer information through its website. That information flows into a data warehouse, where it is combined with purchase records and used to create marketing reports. If the website begins sending incomplete customer IDs, the issue may affect data matching, campaign measurement, customer segmentation, and business reporting.
Each downstream team may see a different symptom of the same underlying problem.
Several factors make these situations more challenging:
Complex data pipelines: Information moves through multiple systems, making it difficult to identify exactly where a failure began.
Delayed detection: Teams may discover issues only when a dashboard looks unusual or a business user questions a report.
Changing data sources: Software updates, new integrations, and changing application behavior can alter the format or volume of incoming data.
Limited visibility: A pipeline may complete successfully even though the information it delivers is incomplete or inaccurate.
Unclear dependencies: Without understanding which systems rely on a particular dataset, teams may struggle to assess the full impact of an issue.
Data observability helps address these challenges by providing a clearer picture of data behavior and its connections throughout the organization.
How Data Observability Works
Data observability combines monitoring, automated checks, historical patterns, and investigative information to help teams detect and resolve data problems.
1. Monitoring Data Freshness
Freshness refers to how recently data has been updated or delivered.
If a reporting dashboard depends on hourly sales data, a delay of several hours may make the dashboard unreliable even when its existing records are correct.
Observability systems can monitor when data was last updated and compare it with expected delivery schedules. When information becomes unusually late, teams can investigate the source before users make decisions based on outdated results.
2. Tracking Data Volume
Data volume monitoring examines how much information enters or moves through a system.
A sudden decrease in transaction records could indicate a failed integration, while an unexpected increase might suggest duplicated events or an application error.
Volume changes are not always signs of failure. Seasonal demand, promotions, and business growth can naturally change record counts. Effective monitoring considers historical patterns and business context rather than treating every change as an emergency.
3. Detecting Schema Changes
A schema defines the structure of a dataset, including field names, data types, and relationships between columns.
Imagine a software update changes a field called customer_id from a numeric value to a text value. If downstream applications expect the original format, data processing may fail or produce unexpected results.
Schema monitoring helps teams identify structural changes and investigate whether they are intentional, compatible, and properly communicated to dependent systems.
4. Identifying Data Quality Issues
Data quality monitoring looks for problems such as missing values, duplicate records, invalid formats, and unexpected distributions.
For example, a shipping dataset might contain postal codes in inconsistent formats. A quality check can identify the inconsistency before it affects address validation or delivery analysis.
Observability adds context by helping teams connect these quality issues with changes in upstream sources, processing steps, or related datasets.
5. Understanding Data Lineage
Data lineage describes how information moves from its original source through transformations and into its final destination.
It can help teams trace a suspicious dashboard metric back to the dataset, transformation, or source application responsible for it.
Lineage is especially useful when a single data source supports many downstream reports. Instead of investigating every affected report separately, engineers can focus on the shared dependency that may have caused the problem.
6. Sending Alerts and Supporting Investigation
When monitoring detects unusual behavior, the system can notify the responsible team through supported alerting channels.
Useful alerts should explain what changed, which dataset is affected, how serious the issue appears to be, and what related systems may depend on it.
The best outcome is not simply generating more notifications. It is helping engineers identify the likely cause quickly and prioritize problems according to their business impact.
A Practical Example: Detecting a Broken Sales Data Pipeline
Consider an online business that uses daily sales reports to plan inventory and evaluate revenue.
Every night, its e-commerce platform sends order records to a central data warehouse. A reporting system then processes those records and updates management dashboards.
One evening, an application change causes some order records to stop reaching the warehouse.
Without sufficient monitoring, the dashboard might show lower sales the following morning. Managers could interpret the decline as a business problem rather than a technical failure.
With data observability, the process could work differently:
- Detect the change: The system identifies that the incoming order volume is significantly lower than its expected pattern.
- Check related signals: Freshness monitoring shows that the latest data arrived later than usual, while pipeline logs reveal a processing warning.
- Trace the source: Data lineage helps engineers identify the integration responsible for transferring order information.
- Assess the impact: The team determines which reports and inventory processes depend on the incomplete dataset.
- Resolve the problem: Engineers correct the integration and reload missing records where possible.
- Verify recovery: Monitoring confirms that incoming data and downstream reports have returned to their expected behavior.
This example illustrates how early detection and clear dependency information can reduce the time spent investigating data failures. It does not eliminate every incident, but it gives teams a better chance of addressing problems before they influence important decisions.
Data Observability vs. Data Quality Monitoring
Data observability and data quality monitoring are closely related, but they are not identical.
Data quality monitoring generally checks whether information meets defined standards. Data observability provides a wider view of data health, including quality, freshness, volume, schema changes, and relationships between systems.
For example, a quality rule might identify that a customer email field contains invalid values. Observability can help teams investigate whether the issue started after a source-system update and determine which downstream datasets may also be affected.
Organizations can use both approaches together. Quality rules establish what acceptable data looks like, while observability helps teams understand changing conditions and investigate failures across the data environment.
Key Benefits of Data Observability
Earlier Problem Detection
Monitoring unusual patterns allows teams to investigate issues before users discover them through inaccurate reports or missing information.
Faster Troubleshooting
Historical signals, pipeline details, and data lineage help engineers narrow down potential causes instead of manually checking every connected system.
More Reliable Analytics
When teams can identify stale, incomplete, or inconsistent datasets, they can make better-informed decisions about whether reports are ready to use.
Better Collaboration Between Teams
Shared visibility into data problems helps data engineers, analysts, application developers, and business stakeholders work from the same information.
Reduced Operational Disruption
Earlier warnings can help teams limit the spread of data failures and prioritize repairs that affect important business processes.
The actual benefits depend on the quality of implementation, the systems being monitored, and how effectively teams respond to detected issues.
Common Challenges When Implementing Data Observability
Although data observability can improve visibility, introducing it across a complex environment requires planning.
Alert fatigue: Too many low-value notifications can cause important warnings to be overlooked. Teams should establish sensible thresholds and prioritize alerts according to their potential impact.
Complex infrastructure: Large organizations may operate multiple databases, cloud services, data warehouses, and third-party integrations. Monitoring coverage must account for these different environments.
Unclear ownership: Alerts are less useful when nobody knows who is responsible for investigating them. Each critical dataset should have an identified owner or support team.
Implementation costs: Monitoring tools, integrations, storage, and engineering time can add to operational expenses. Organizations should start with high-value data pipelines rather than attempting to monitor everything immediately.
False alarms: Normal business changes can resemble technical failures. Historical trends, business calendars, and contextual rules can help reduce unnecessary alerts.
Privacy and access control: Monitoring information may expose sensitive metadata or business details. Organizations should apply appropriate permissions, retention policies, and security controls.
Addressing these challenges early makes observability more useful and helps prevent the monitoring process from becoming another source of operational complexity.
How to Build a Practical Data Observability Strategy
A successful approach does not require every dataset to be monitored on the first day. Organizations can build coverage gradually, focusing on the information that matters most.
Step 1: Identify Critical Data Assets
Start with datasets that support financial reporting, customer operations, regulatory obligations, inventory management, or other essential activities.
Step 2: Establish Normal Data Behavior
Understand expected delivery times, typical record volumes, valid field formats, and normal patterns. These baselines help distinguish meaningful anomalies from routine changes.
Step 3: Monitor the Most Important Signals
Begin with freshness, volume, schema changes, and essential data quality checks. Add more advanced monitoring when the need becomes clear.
Step 4: Map Dependencies
Document which pipelines, dashboards, models, and applications rely on critical datasets. This makes it easier to estimate the impact of a problem.
Step 5: Define Alert Ownership
Assign responsibility for investigating incidents and create a clear process for escalation, correction, and verification.
Step 6: Review and Improve
Track recurring incidents, detection delays, resolution times, and false alarms. Use these findings to improve monitoring rules and prevent similar failures.
This incremental approach helps organizations demonstrate value early while building a more comprehensive view of their data infrastructure over time.
The Future of Data Observability
As organizations adopt cloud-native architectures, real-time analytics, and AI-driven applications, the need for trustworthy data continues to grow.
Automated anomaly detection can help teams identify patterns that fixed rules might miss. AI-assisted investigation may also help engineers summarize incidents, connect related alerts, and suggest possible causes. However, these capabilities depend on reliable signals, appropriate context, and human validation.
Data observability is also becoming increasingly important for machine learning systems. Changes in incoming data can affect model inputs and the reliability of generated predictions. Monitoring data behavior helps teams identify potential problems earlier, although it does not replace dedicated model evaluation, performance monitoring, or governance.
The broader direction is toward more proactive data management, where teams can understand the health of important datasets and their dependencies instead of relying entirely on users to report problems.
Conclusion
Data observability gives organizations a more complete understanding of how their data behaves, where problems begin, and which systems may be affected.
By monitoring freshness, volume, schema changes, data quality, and lineage, teams can detect warning signs earlier and investigate incidents with greater confidence. Its real value comes from combining useful monitoring signals with clear ownership, effective incident response, and continuous improvement.
As data becomes more deeply embedded in business operations and AI applications, maintaining reliable information is no longer just a technical concern. It is an important part of making sound decisions and keeping digital systems dependable.
For organizations seeking to reduce unexpected data failures, data observability offers a practical foundation for moving from reactive troubleshooting toward more proactive data reliability.
Frequently Asked Questions
1. What is data observability?
Data observability monitors data health, quality, freshness, and behavior to identify problems across connected systems.
2. How does data observability detect problems early?
It monitors data volume, freshness, schema changes, and quality patterns to help teams identify and resolve issues earlier.
3. What is the difference between data observability and data quality?
Data quality checks whether information meets defined standards, while data observability provides broader visibility into data health, pipelines, and potential problems.
4. Why is data observability important for businesses?
It helps businesses detect data issues, troubleshoot failures, improve analytics reliability, and make informed decisions.